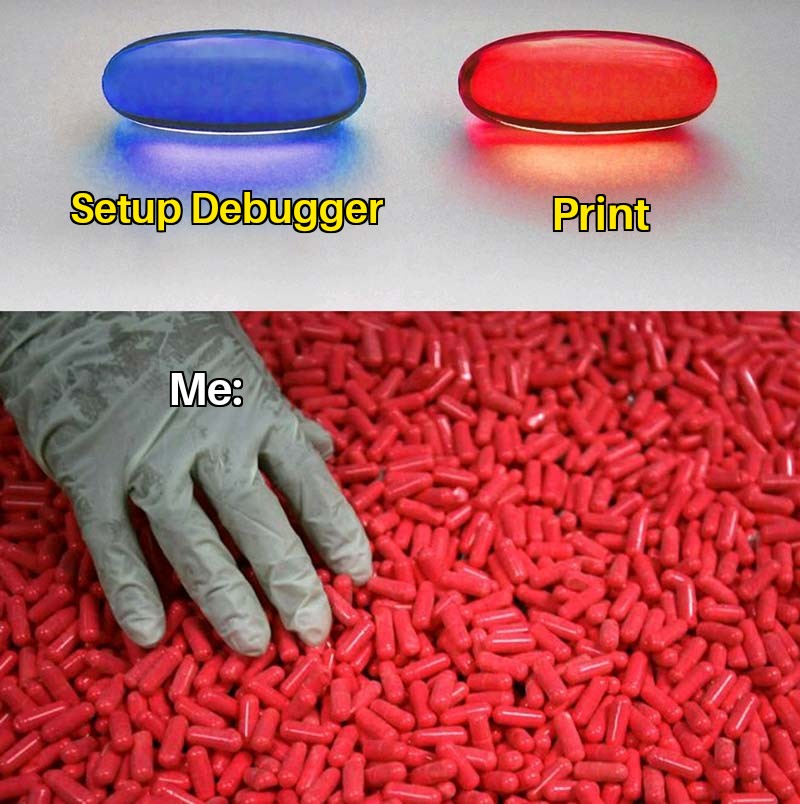
Debugging, and debuggers
Show both command-line debuggers, IDE debuggers
Show some basic strategies:
- Breakpoint before the error
- Inspect variables
- Use conditional breakpoints to wait for the trigger
- Use a debugger with a unit test
By the end of this module students should be able to:
- be comfortable using a debugger.
- be able to set breakpoints, and conditional breakpoints.
- be able to inspect variables in code that is running.
- know that just using print statements in an anti-pattern.
- be able to trigger the error that is being debugged with a unit test.
- know why unit tests are better than debugging by-hand.
printf("I am here")

We all start here: have a print statement to show us how our program is executing. This can be as simple as the title of this section: showing us that the program got to this line of code, or, maybe print out the current state of a variable.
And, this is great! But, it doesn’t scale. But learning a debugger is hard, and feels like it wastes more time than you get back. Which is only true for the first time. You will debug faster for the rest of your life!
That sounds like hyperbole, but it is true. As your programs get bigger, and
more advanced, the print method gets less and less effective. Debuggers
are the only way to really get into your running code - and learning
how to use a debugger on a smaller program earlier in your life is a great
idea.
Enough with the sales pitch
print is great, but what we actually want to do is
stop execution, and inspect variables at our own pace.
Debuggers are diverse in how they approach stopping code. This will lightly cover both command-line debuggers, and GUI debuggers. The concepts are all the same for any debugger, adn this will give you the knowledge about what is possible with debuggers.
There is debuggers for (almost?) every language:
pdbfor Python- Node.js/Javascript/Ecmascript
gdbwhich can debug a number of compiled languages, notably C, C++, Rust and Go.lldbwhich is the clang derivative for compiled languages, and acts much likegdb. Debugs C, C++, Objective-C. There is even a gdb to lldb command map.- Browsers have built-in Javascript/Ecmascript debuggers!
Breakpoints, and stepping
This is the number one thing we use to debug our code. We can set breakpoints where we want our code to stop running, so we can inspect our code at that point, including view the stack, so we can see how we got here. We can then do a number of things. These are the usual names for the actions:
- Step/step in: run the next line of code. If the next line of code is a function call, step into that function.
- Next/step over: Run the next line of code. If it’s a function call, run that function to its completion. So, this is the next line of code in this function.
- Continue: Just go and execute. It will stop again if/when it hits a breakpoint - including this breakpoint if it hits it again.
There are generally a lot more commands, but these are the key tools to get you going.
Conditional breakpoints
These prevent you from writing silly if statements to selectively stop
your code. The variety of how these work is wide, but generally, they allow
you to write a conditional to trigger the breakpoint. x > 10 or count == 0.
You can use variables that are in-scope for the stack frame the breakpoint is
in.
Watching variables
When we’re stopped. We can inspect variables. If we are curious about certain variables, we can watch them. This is an easy-to-get-to list of variables we care about. We can inspect any variables that we are curious to see the state of, but the watch list makes it more convenient.
Short chapter?
Maybe a little. Check out the demos - this is best seen, not read!
C/C++
Python
Javascript in-browser
Java
Activities
TODO
- Python script to debug, pass as value/reference immutable issues.
- C file that has malloc issue.
- Java file with integer overflow